Đây là hướng dẫn xây dựng một hệ thống báo cáo SEO chuyên nghiệp — từ giám sát hằng ngày (daily monitoring) đến báo cáo tháng cho khách hàng — sử dụng Looker Studio, GA4, Search Console và các công cụ chuyên dụng.
SEO Reports — "Vũ khí" thuyết phục stakeholders
Một sự thật phũ phàng tại Việt Nam: 90% SEO agency mất khách hàng KHÔNG phải vì SEO performance kém, mà vì báo cáo không thuyết phục.
Lý do agency mất khách hàng SEO | Tỷ lệ |
|---|---|
Báo cáo khó hiểu | 40% |
Không show ROI | 25% |
Không actionable | 20% |
Format không nhất quán | 10% |
Giao báo cáo trễ | 5% |
Trong khi đó, các agency hàng đầu đều có hệ thống báo cáo chuyên nghiệp: dashboard real-time cho stakeholder truy cập bất cứ lúc nào, báo cáo tháng với insight rõ ràng, quarterly business review thể hiện tác động chiến lược, và cảnh báo tự động khi có sự cố. Bài viết này dành cho: SEO agency báo cáo cho khách hàng; in-house SEO báo cáo cho ban lãnh đạo; marketing manager đo lường hiệu suất; và freelancer muốn chuyên nghiệp hóa dịch vụ.
Phần 1: Triết lý báo cáo (Reporting Philosophy)
1.1. Tháp báo cáo (The Reports Pyramid)
Mỗi đối tượng cần một loại báo cáo khác nhau:
Cấp độ | Đối tượng | Tần suất | Trọng tâm |
|---|---|---|---|
Executive | CEO, Board | Tháng/Quý | Chỉ số cấp cao, tập trung ROI |
Management | Director, Manager | Tuần/Tháng | Insight chiến thuật, action item |
Operational | Analyst, SEO Team | Hằng ngày | Dữ liệu real-time, chi tiết granular |
1.2. Báo cáo phải trả lời 3 câu hỏi
Mỗi báo cáo cần trả lời: Điều gì đã xảy ra? (dữ liệu + metrics), Vì sao nó xảy ra? (phân tích + bối cảnh), và Chúng ta làm gì tiếp theo? (khuyến nghị + action item). Sai lầm là biến báo cáo thành một "bãi đổ dữ liệu" (data dump); đúng là biến nó thành một "câu chuyện" có insight và hành động.
1.3. Chỉ số SMART
Một mục tiêu tốt cần: Specific (cụ thể — thay vì "tăng organic traffic" thì "tăng 30% traffic vào các trang /services/"), Measurable (có số rõ ràng), Achievable (khả thi), Relevant (gắn với mục tiêu kinh doanh), và Time-bound (có deadline cụ thể).
Phần 2: Các chỉ số SEO thiết yếu
2.1. Chỉ số hiển thị (Visibility)
Theo dõi: thứ hạng từ khóa, điểm hiển thị tổng thể, số Featured Snippets, sự hiện diện Knowledge Panel, số site links, kết quả hình ảnh/video. Công cụ: Ahrefs (Rank Tracker), SEMrush (Position Tracking), Search Console (Performance).
2.2. Chỉ số lưu lượng (Traffic)
Chỉ số cốt lõi: organic users, organic sessions, mới vs quay lại, phân bố địa lý, thiết bị, so sánh kênh. Chỉ số chất lượng: engagement rate, thời gian tương tác trung bình, pages per session, bounce rate (nay = 1 − engagement). Nguồn: GA4 + Search Console.
2.3. Chỉ số hành vi (Behavior)
Top landing pages, top exit pages, user flow, truy vấn tìm kiếm nội bộ, click liên kết nội bộ, mức tương tác nội dung.
2.4. Chỉ số chuyển đổi (Conversion)
Theo dõi: conversion rate (tổng thể + organic), số conversions, giá trị chuyển đổi, goal completions, form submissions, cuộc gọi, đăng ký email, doanh thu (ecommerce). KPI kinh doanh: CPA, CLV, ROI, ROAS. Đây là nhóm chỉ số gắn trực tiếp với việc đo lường và tối ưu tỷ lệ chuyển đổi (CRO).
2.5. Chỉ số kỹ thuật (Technical)
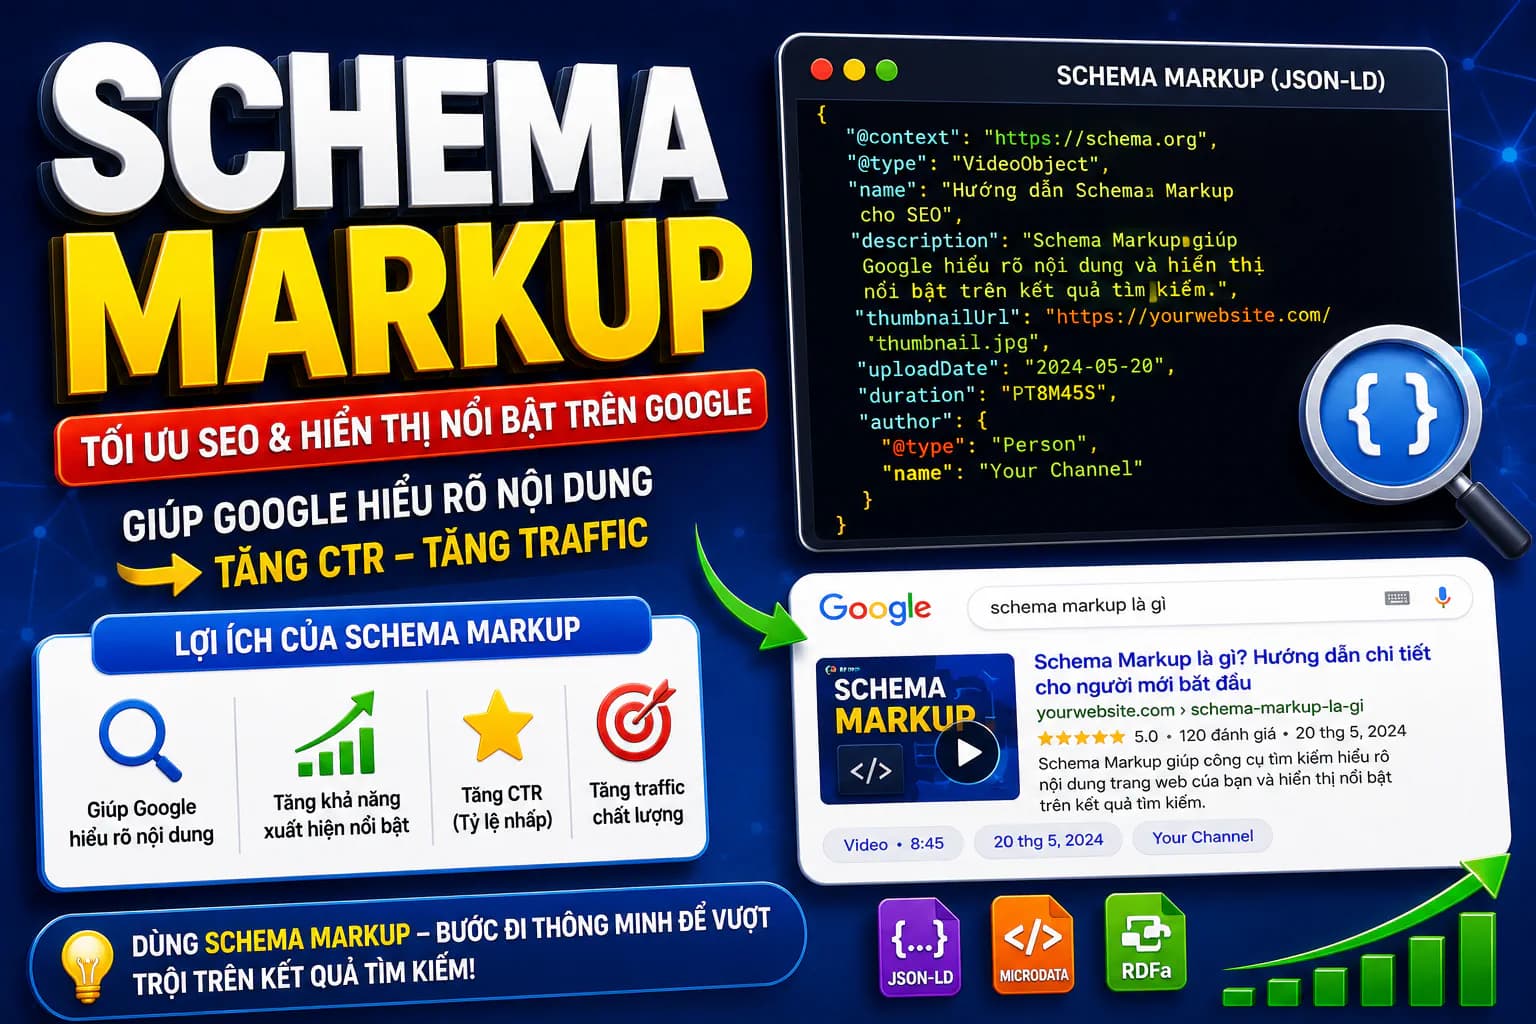
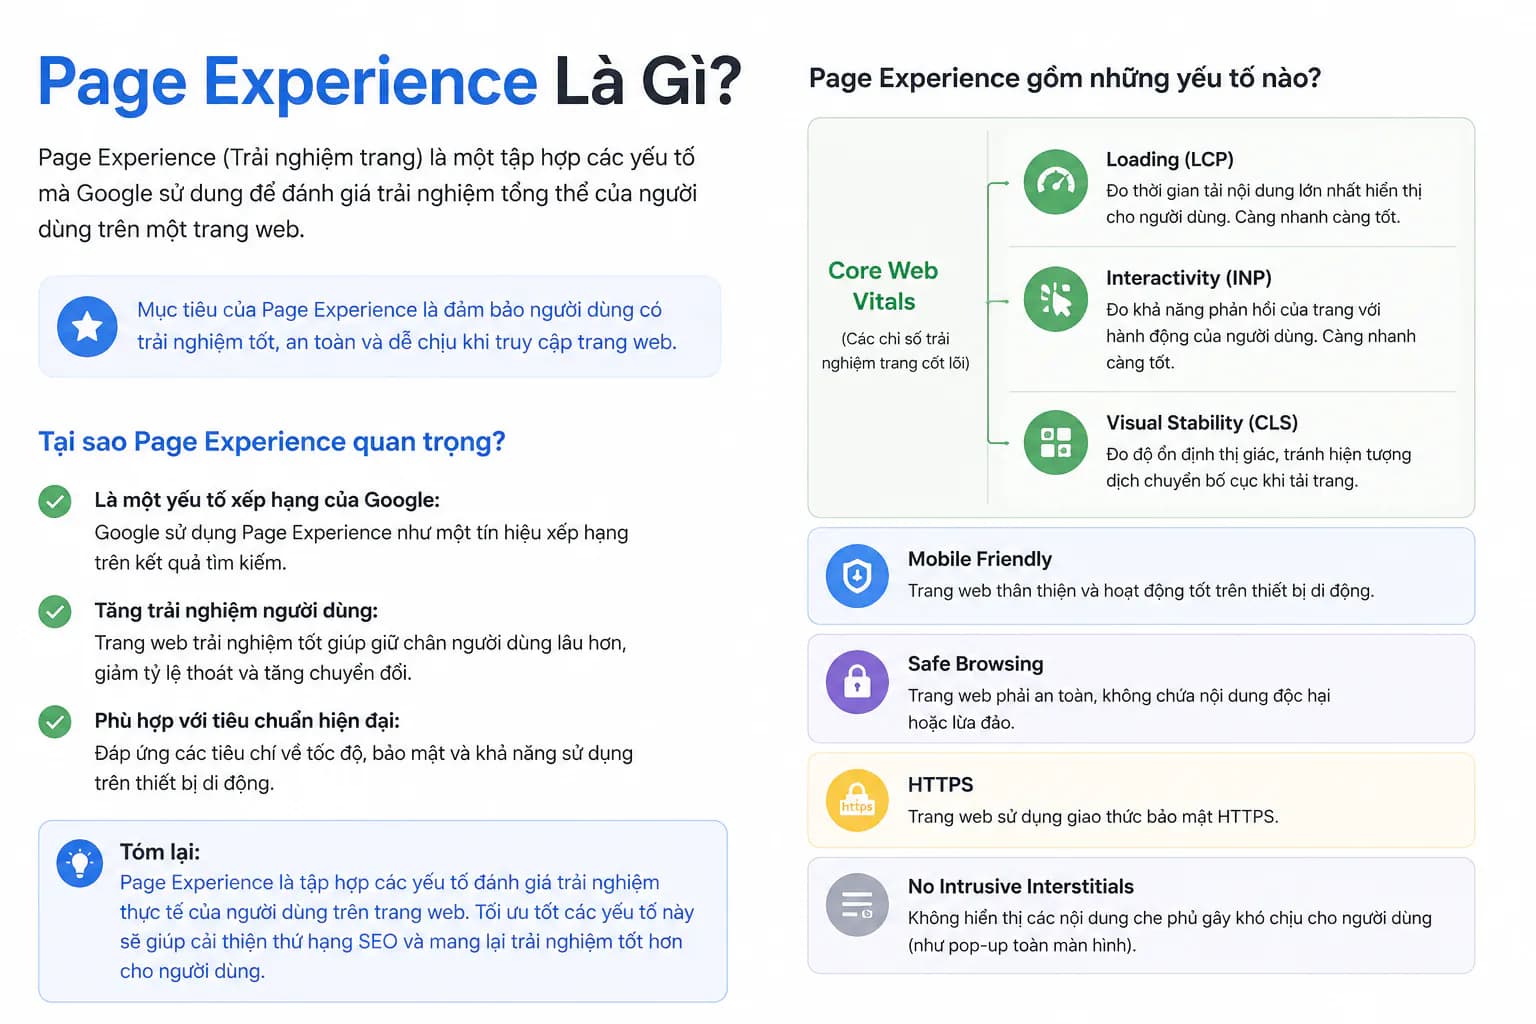
Crawl errors, index coverage, Core Web Vitals, mobile usability, trạng thái schema markup, trạng thái sitemap, HTTPS. Đây là các chỉ số Technical SEO cần theo dõi định kỳ. Nguồn: Search Console + công cụ (Screaming Frog...).
2.6. Chỉ số uy tín (Authority)
Domain Rating (Ahrefs), Domain Authority (Moz), tổng backlinks, referring domains, link mới vs mất, phân bố anchor text.
Phần 3: Công cụ cho báo cáo
3.1. Công cụ miễn phí
Google Looker Studio: dashboard đẹp, miễn phí, kết nối GA4 và Search Console, tự động làm mới dữ liệu.
Google Sheets: báo cáo tùy chỉnh, dữ liệu thủ công + công thức, biểu đồ, dễ chia sẻ.
Google Analytics 4: báo cáo sẵn có, báo cáo tùy chỉnh, Explorations, Insights AI.
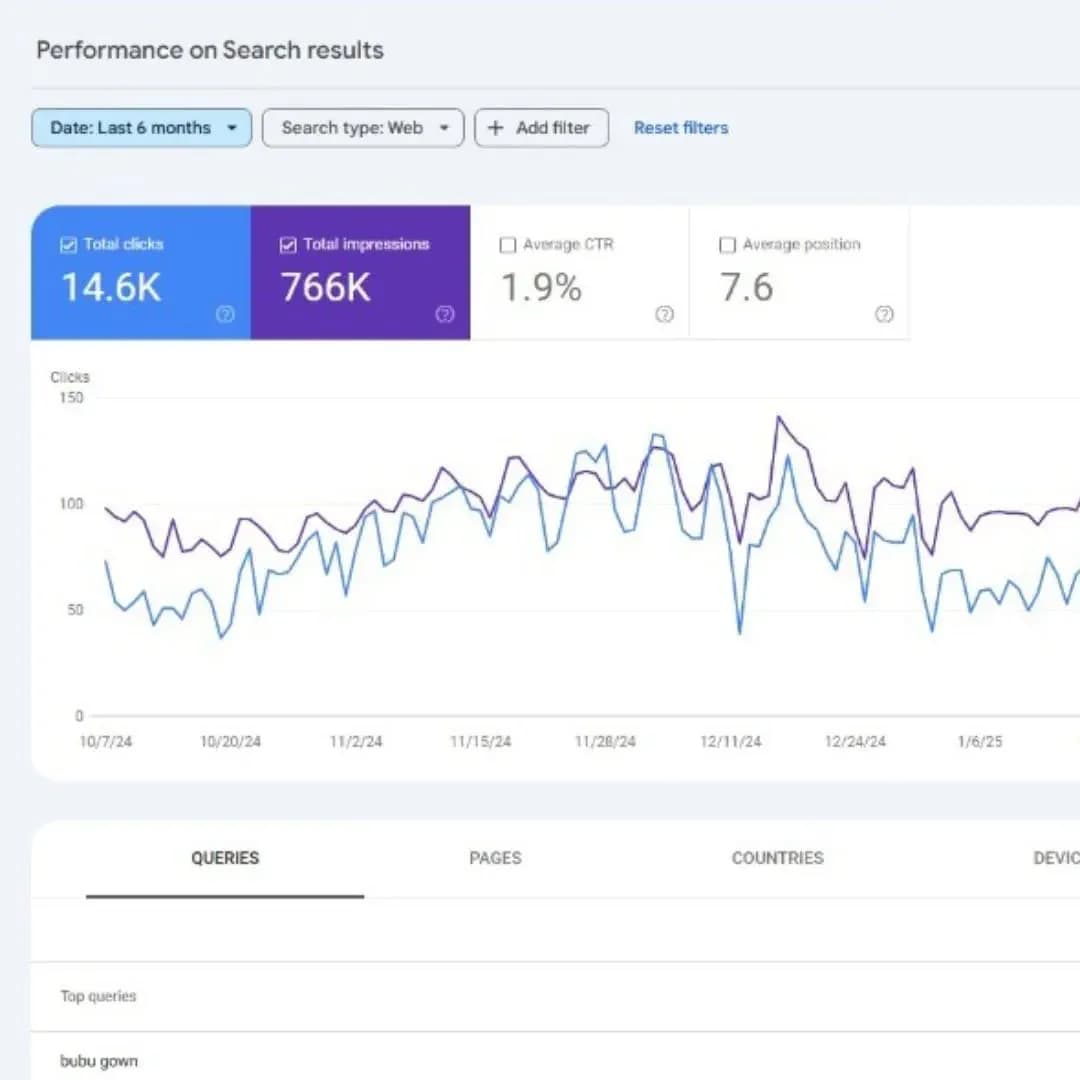
Google Search Console: báo cáo Performance, trạng thái index, Core Web Vitals, mobile usability.
3.2. Công cụ trả phí
Ahrefs: dữ liệu SEO toàn diện, rank tracking, phân tích backlink, site audit, báo cáo tự động.
SEMrush: tương tự Ahrefs, position tracking, phân tích cạnh tranh, quản lý dự án.
Sistrix: chỉ số hiển thị (visibility index), kiểm tra sức khỏe nhanh, tập trung thị trường châu Âu.
SE Ranking: giải pháp giá tốt, tùy chọn white-label, báo cáo khách hàng, đa ngôn ngữ.
AccuRanker: rank tracking chính xác nhất, dữ liệu real-time, cập nhật hằng ngày.
3.3. Nền tảng báo cáo chuyên dụng
Whatagraph (dashboard đa nguồn, 40+ tích hợp, white-label, client portal); AgencyAnalytics (dành cho agency, quản lý khách hàng, báo cáo tự động, white-label); Klipfolio (dashboard tùy chỉnh, dữ liệu live); DashThis (template dễ dùng, đa nguồn, giá tốt).
3.4. Bộ công cụ Tấn Phát Digital khuyến nghị
Nền tảng miễn phí: GA4, Search Console, Looker Studio.
Công cụ Pro: Ahrefs (toàn diện), Screaming Frog (kỹ thuật).
Báo cáo: Looker Studio (dashboard) + báo cáo PDF (deliverable cho khách).
Tự động hóa: email báo cáo theo lịch, cảnh báo qua Slack/email.
Phần 4: Giám sát hằng ngày (Daily Monitoring)
4.1. Cảnh báo real-time
Thiết lập cảnh báo cho: sụt traffic (−20% ngày/ngày, −50% một trang cụ thể, sụt theo kênh); lỗi site (5xx spike, lỗi 404 và crawl error tăng đột biến, mobile usability); vấn đề thứ hạng (rớt top 10, mất Featured Snippet, lỗi indexing); và vấn đề chuyển đổi (0 conversion trong 24h, lỗi form, checkout abandonment tăng vọt).
4.2. Dashboard hằng ngày
Kiểm tra buổi sáng (5 phút): traffic organic hôm qua vs trung bình tuần, conversion hôm qua vs trung bình tuần, top 5 trang có traffic, có spike lỗi không, Search Console có vấn đề không, cảnh báo rank tracking. Nếu tất cả "xanh" → làm việc bình thường; nếu có cảnh báo → điều tra ngay.
4.3. Công cụ giám sát
Email alerts (GA4 custom insights, Search Console alerts, Ahrefs alerts, custom scripts); mobile apps (GA4, Search Console, Ahrefs); tích hợp Slack (GA4 → Slack, Search Console alerts, bot theo công cụ).
Phần 5: Báo cáo tuần (Weekly Reports)
5.1. Mẫu tóm tắt tuần (cho SEO team)
Một báo cáo tuần chuẩn gồm các mục: Điểm nhấn trong tuần (3 thắng lợi lớn); Chỉ số chính week-over-week (organic users, sessions, conversions, conversion rate, revenue — kèm % tăng/giảm); Cập nhật thứ hạng (số từ khóa vào/rớt top 10, Featured Snippet vào/mất); Vấn đề kỹ thuật (kèm trạng thái); Nội dung đã xuất bản; Link kiếm được (nguồn + DR, tổng referring domains mới); Ưu tiên tuần tới; và Hạng mục cần chú ý.
5.2. Phân bổ thời gian trong tuần
Sáng thứ Hai (1h): review dữ liệu cuối tuần, lên ưu tiên tuần, gửi update thứ Hai.
Kiểm tra hằng ngày (15 phút): review nhanh dashboard, xử lý cảnh báo, ghi nhận cơ hội.
Chiều thứ Sáu (2h): tổng hợp chỉ số tuần, viết tóm tắt, gửi báo cáo, lên kế hoạch tuần sau.
Phần 6: Báo cáo tháng (Monthly Reports)
6.1. Cấu trúc báo cáo tháng (10–15 trang)
Executive Summary (1 trang): tháng tổng quan, top 3 wins, top 3 thách thức, tiến độ so với mục tiêu, trọng tâm tháng sau.
Phân tích traffic (2 trang): xu hướng organic (tháng + YoY), nguồn traffic, top landing pages, thiết bị, địa lý, engagement.
Hiệu suất từ khóa (2 trang): top keyword, cơ hội xếp hạng mới, phân tích vị trí mất, Featured Snippets, so sánh đối thủ.
Phân tích chuyển đổi (2 trang): tổng quan conversion, xu hướng CR, top trang chuyển đổi, conversion paths, tác động doanh thu, tính ROI.
Technical SEO (1–2 trang): sức khỏe site, crawl errors đã sửa, Core Web Vitals, mobile usability, schema.
Hiệu suất nội dung (1–2 trang): nội dung đã xuất bản, top performers, nội dung cần tối ưu, content gap.
Link building (1 trang): link mới, thay đổi uy tín, chiến dịch outreach, giám sát toxic links.
Kế hoạch tháng sau (1 trang): mục tiêu cụ thể, action items, nguồn lực, kết quả kỳ vọng.
6.2. Chọn biểu đồ hiệu quả
Loại biểu đồ | Dùng tốt nhất cho |
|---|---|
Line chart | Xu hướng theo thời gian (traffic, thứ hạng) |
Bar chart | So sánh (kỳ này vs kỳ trước) |
Pie chart | Phân bổ (kênh, thiết bị) — dùng hạn chế |
Heatmap | Hành vi người dùng, địa lý |
Funnel chart | Luồng chuyển đổi |
Gauge chart | Tiến độ so với mục tiêu |
6.3. Báo cáo theo từng đối tượng
Đối tượng | Trọng tâm báo cáo | Độ dài |
|---|---|---|
CEO/Chủ DN | Revenue, ROI, vị thế cạnh tranh, insight chiến lược | Tối đa 1 trang |
Marketing Director | Hiệu suất kênh, attribution, brand health, lead gen | 3–5 trang |
SEO Specialist | Chỉ số chi tiết, lỗi kỹ thuật, insight chiến thuật, dữ liệu tool | 10+ trang |
Content Team | Hiệu suất nội dung, cơ hội từ khóa, engagement, content gap | Tùy nhu cầu |
Phần 7: Dashboard Looker Studio
7.1. Bố cục dashboard cơ bản
Một dashboard SEO hiệu quả thường bố trí theo hàng: Hàng 1 — chỉ số tổng quan (Organic Users, Conversions, Revenue kèm so sánh tháng trước); Hàng 2 — xu hướng traffic (line chart 90 ngày); Hàng 3 — top content + search queries (bảng top landing pages và top truy vấn); Hàng 4 — thiết bị + địa lý (pie chart thiết bị, bản đồ/bar chart địa điểm); Hàng 5 — chuyển đổi (funnel chart + bảng top trang chuyển đổi).
7.2. Quy trình thiết lập
Tạo dashboard mới tại lookerstudio.google.com.
Kết nối nguồn dữ liệu: GA4 (traffic, conversions), Search Console (queries, impressions), BigQuery (dữ liệu thô nâng cao), Sheets (dữ liệu tùy chỉnh).
Xây dựng visualization: scorecard (số), time series (xu hướng), table (danh sách), chart (so sánh).
Thêm bộ lọc: khoảng thời gian, thiết bị, địa điểm, trang.
Style + branding: màu thương hiệu, logo, font, bố cục.
Chia sẻ: link email, nhúng vào client portal, gửi email theo lịch, export PDF.
7.3. Template có sẵn
Miễn phí: template SEO dashboard, Search Console, GA4. Trả phí: thiết kế cấp agency, template đa khách hàng, dashboard chuyên biệt.
Phần 8: Best Practices khi báo cáo cho khách hàng
8.1. Thiết lập kỳ vọng
Onboarding tháng đầu: làm rõ nhu cầu báo cáo (tần suất, format PDF/dashboard, mức chi tiết, stakeholder, KPI quan trọng); và thiết lập kỳ vọng thực tế — đặc biệt về lộ trình SEO thực tế 6–12 tháng, biến động thuật toán là điều tất yếu, và tư duy dài hạn vs ngắn hạn. Cuối cùng, định nghĩa metric thành công (mục tiêu cụ thể, có thể đo, có timeline).
8.2. Kể chuyện bằng dữ liệu
Báo cáo dở chỉ ghi:
"Organic traffic tháng này đạt 15.000 users."
Báo cáo tốt kể trọn câu chuyện:
"Organic traffic tăng lên 15.000 users tháng này — tăng 25% so với tháng trước. Mức tăng chủ yếu đến từ nội dung mới về [chủ đề], bắt đầu xếp hạng cho các từ khóa giá trị cao như '[từ khóa 1]' và '[từ khóa 2]'. Điều này tương đương khoảng 50 lead mới, ước tính 200 triệu VND giá trị pipeline."
Công thức kể chuyện: Bối cảnh (điều gì là bình thường?) → Sự kiện (điều gì đã thay đổi?) → Tác động (vì sao nó quan trọng?) → Hành động (bước tiếp theo là gì?).
8.3. Phân cấp trực quan
Quan trọng nhất để trước (trang 1 executive summary, trang 2 wins/thách thức, trang 3+ chi tiết). Yếu tố trực quan: branding nhất quán, font dễ đọc, nhiều khoảng trắng, phân vùng theo màu, ưu tiên biểu đồ hơn bảng. Đảm bảo đọc được trên mobile (nhiều stakeholder đọc trên điện thoại): test giao diện mobile, font lớn, xếp cột dọc.
8.4. Câu hỏi thường gặp của khách hàng
"Vì sao organic traffic giảm tháng này?" → giải thích bằng dữ liệu: yếu tố mùa vụ, tác động cập nhật thuật toán, thay đổi trên trang cụ thể, và kế hoạch chẩn đoán, phục hồi khi traffic giảm nếu cần.
"So với đối thủ thì sao?" → phân tích cạnh tranh, xu hướng thị phần, share of voice, cơ hội.
"ROI là bao nhiêu?" → tính giá trị lead, attribution doanh số, CLV, so sánh với kênh trả phí.
"Khi nào thấy kết quả lớn?" → thực tế timeline SEO, tiến độ hiện tại, các mốc kỳ vọng, tầm nhìn dài hạn.
Phần 9: Quarterly Business Review (QBR)
9.1. Cấu trúc QBR (họp chiến lược 90 phút)
Executive Summary (15 phút): điểm nhấn quý, KPI vs mục tiêu, phân tích ROI, wins/thách thức lớn.
Deep Dive Performance (30 phút): xu hướng traffic, hiệu suất từ khóa, hiệu suất nội dung, phân tích chuyển đổi, bối cảnh cạnh tranh.
Strategic Insights (20 phút): xu hướng ngành, tác động thuật toán, cơ hội mới nổi, mối đe dọa cần xử lý.
Kế hoạch quý sau (20 phút): ưu tiên chiến lược, sáng kiến cụ thể, nguồn lực, kết quả kỳ vọng.
Q&A + thảo luận (5 phút).
9.2. Tài liệu QBR
Trước họp: gửi agenda trước 1 tuần, tài liệu pre-read, thiết lập kỳ vọng. Trong họp: slide trình bày, demo dashboard live, điểm thảo luận, quyết định. Sau họp: biên bản, action item kèm người phụ trách, timeline bước tiếp theo, lịch follow-up.
Phần 10: Những sai lầm thường gặp
Sai lầm | Nên làm |
|---|---|
Chỉ có số liệu, không insight | Số liệu + phân tích + khuyến nghị |
Quá nhiều thông tin (báo cáo 50 trang không ai đọc) | Báo cáo tập trung, dễ quét |
Vanity metrics (tổng backlink bất kể chất lượng) | Backlink uy tín thực sự kiếm được |
Thiếu bối cảnh kinh doanh ("traffic +20%") | "Traffic +20% = X trong pipeline" |
Format không nhất quán mỗi tháng | Template nhất quán |
Giao báo cáo trễ (tuần 2 của tháng sau) | Giao ngày 3–5 của tháng sau |
Một mẫu cho tất cả đối tượng | Tùy chỉnh theo từng đối tượng |
Không có action item | Bước hành động rõ ràng |
Chỉ báo cáo thành công, giấu thất bại | Trung thực về thách thức |
Chỉ dữ liệu nội bộ, không có đối thủ | Bổ sung bối cảnh ngành |
Nhiều chỉ số phù phiếm (vanity metrics) mà các dịch vụ SEO kém hay dùng để che giấu hiệu quả thật chính là dấu hiệu cần cảnh giác — một hệ thống báo cáo trung thực sẽ luôn gắn số liệu với giá trị kinh doanh.
Kết luận
Báo cáo là yếu tố "make-or-break" cho thành công SEO. Doanh nghiệp có hệ thống báo cáo chuyên nghiệp sẽ giữ khách lâu hơn, định giá cao hơn và mang lại kết quả tốt hơn.
Năm thông điệp cuối:
Báo cáo kể chuyện, không chỉ là dữ liệu.
Mỗi đối tượng cần một loại báo cáo khác nhau.
Trực quan + dễ quét = tương tác tốt hơn.
Insight hành động được quan trọng hơn biểu đồ đẹp.
Nhất quán + đúng hạn là yếu tố then chốt.
Nếu doanh nghiệp bạn muốn một hệ thống báo cáo SEO minh bạch, gắn số liệu với doanh thu, hãy để Tấn Phát Digital xây dựng chiến lược và hệ thống đo lường SEO phù hợp — hoặc liên hệ Tấn Phát Digital để được tư vấn.


![Hình ảnh đại diện của bài viết: [Series] Hỏi Chuyên Gia SEO — Kỳ 3: SEO Content hay AI Content — cái nào hiệu quả 2026](/_next/image?url=https%3A%2F%2Fcdn.tanphatdigital.com%2Fimages%2Fseries-hoi-chuyen-gia-seo-ky-3-seo-content-hay-ai-content-cai-nao-hieu-qua-2026.webp&w=1920&q=75)
![Hình ảnh đại diện của bài viết: [Series] Hỏi Chuyên Gia SEO — Kỳ 2: Chiến Lược Backlink Trong Kỷ Nguyên AI](/_next/image?url=https%3A%2F%2Fcdn.tanphatdigital.com%2Fimages%2Fseries-hoi-chuyen-gia-seo-ky-2-chien-luoc-backlink-trong-ky-nguyen-ai.webp&w=1920&q=75)